The Center of it All: The Scientific Method of Inquiry!
Lora Holt, M.Ed
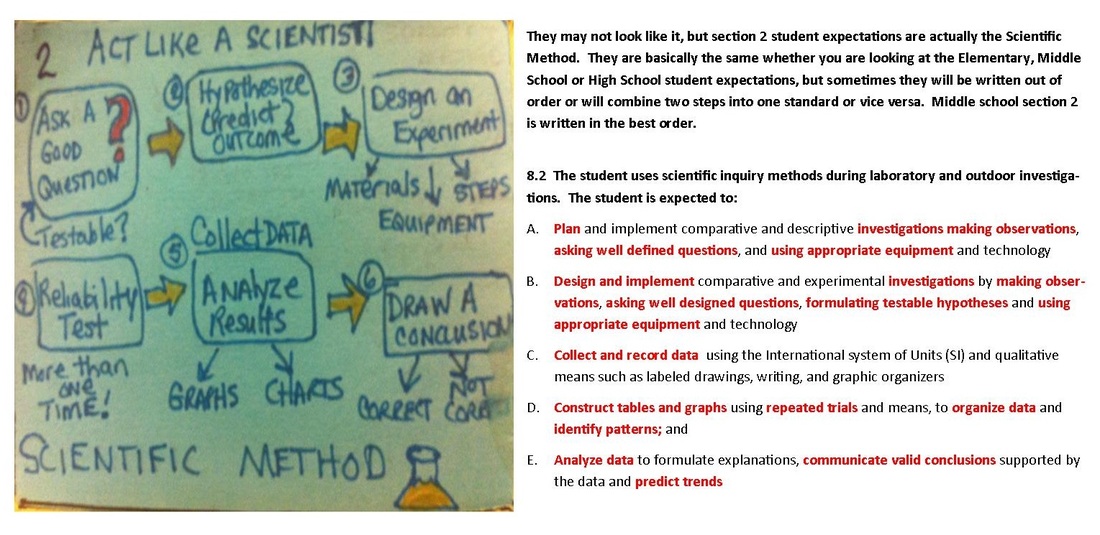
If you were only able to list 3-4 steps to the Scientific Method, you are not alone. I think as teachers we have spent so much time thinking about scientific content, that we forget that scientists have to prove everything that they find, discover or write about to the scientific community in order for it to become scientific fact. The language of Science is DATA collection, which is why ALL of Section 2 in our Knowledge and Skills Statements for Science is dedicated to Scientific Inquiry Methods and the ability of students to CHOOSE TOOLS and DESIGN their own investigations, TEST REPEATEDLY for accuracy, COLLECT data, ORGANIZE the data that they collect so that it is easy to read and interpret, ANALYZE, INFER and PREDICT TRENDS from data, and arrive at a CONCLUSION from direct and indirect evidence. Draw or list the steps of the Scientific Method under door number two of your folded graphic organizer. To review your processes remember, any student expectation that starts with a 1 is safety and conservation of resources. Any student expectation that starts with a 2 is the Scientific Method of Inquiry.
The Good, the Bad and the Scientific Method
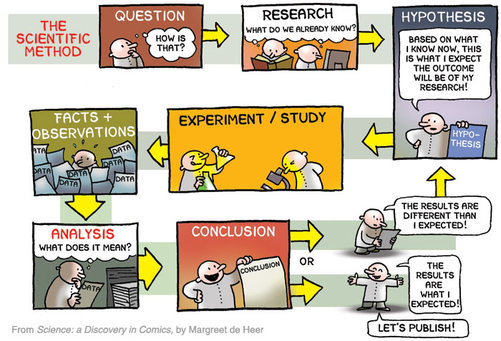
I know, I know, Texas has made a big deal over the Scientific Method in the past few years. You may have heard it referred to as the components of Scientific Inquiry because in the real world the Scientific Method doesn't really happen in a specific order. A scientist may not always start off with a Question and then go right into Research and then a Hypothesis. I have even been to trainings where a very noted person said to take down all of our Scientific Method posters in our science labs because Texas doesn't teach the scientific method anymore! But before we throw the baby out with the bath water, we need to look at things reasonably before we start calling it a "witch" and burn it at the stake. If you look at the knowledge and skills statements of all of the science process standards 3-12, you will notice that the skills listed under "Scientific Inquiry Methods" look very similar (if not exactly like) the Scientific Method. That is why I asked you to list the steps of the scientific method, because if you know those steps, you pretty much have section 2 down and can use it. This workshop is all about making things easy to teach and do...
So lets address the elephant in the room, the part that is making you feel like you are breaking a rule because you have been told that Texas Science is all about 3 Investigations of Inquiry. For example some scientists discover phenomenon through observation and describing what took place, not necessarily testing. Sometimes scientists are looking for correlations from indirect data. This is the reason for coming up with the " 3 TYPES OF INVESTIGATIONS: Descriptive, Comparative and Experimental." I will address cooking with those 3 later, because really in the realm of scientific inquiry, all 3 of the investigations have elements of the Scientific Method in them because all science is truly proven through the Scientific Method. Yes scientists make descriptive and comparative observations, but when their conclusions from their observations or their comparative studies are published you better believe that there is some scientist out there waiting in the wings to replicate the work through the Scientific Method. Science is all about proving things and the Scientific Method is the accepted way of proving science around the world.
Replication and Reliable Testing
The idea of REPLICATION is super important. If things cannot be replicated in a lab or observed repeatedly in a natural setting then ideas are disproved. Scientific history is super exciting to read about just because of all of the arguments and fights that scientists have had with each other as they've tried desperately to disprove each other. Current results in Science testing for STAAR indicate that kids have problems understanding data collection and it may be because we don't spend enough time in the classroom allowing kids to take data collection through the whole process. My personal belief is that by concentrating so much on getting kids to identify different types of investigations we might have forgotten that there are rules for how to prove your work, which is to provide replicable and reliable data. Just know that Scientific Inquiry Methods are super important to the world of Science and we should be giving them a direct teach, even if that means chopping the steps into pieces and infusing them into different types of inquiry so that kids can get more practice.
But I do hands-on investigations in the lab, doesn't that mean we are already doing Scientific Inquiry Methods?...
Just because you do inquiry or hands-on lab investigations doesn't mean that your kids are aware of the Scientific Method, what it is and how to use it. Here is a great way to tell, ask yourself these questions:
Letting your kids have Aha moments with Data Collection:
Do your kids know why it is that scientists organize information? Data collection can be lengthy and voluminous. Just because they are able to fill in a data table or are able to plot a graph or even read it, do they know why they are making a chart or graph in the first place? The whole purpose for organizing data is to take information that is collected and make it so it is easier to read. The only way your kids will actually learn this lesson is if students are allowed to design and create their own data collections! Data collection in the classroom has become a time spent filling out forms, a meaningless task that kids have to do while they are checking out a cool phenomena. Do they care about the data they are collecting? Not necessarily. I asked my students to remember a graph we filled in from a cookie cutter worksheet (you know, the kind with the built in graph lines) and they couldn't remember the graph they filled out. I was surprised because they really loved that lab, but as it turned out, they loved the activity, not the data collection. I spurred their memory when I said, "you remember, the time we were timing the melting ice cubes?" and all of a sudden they remembered! Wouldn't it be something if I could have said, "Remember that awesome graph you designed about the melting point?"
Kids also need to realize what types of organizations are more efficient. Is it better to use a table or graph or both? Can the data even be graphed? Do I use a triple t chart or a Venn diagram? When kids are allowed to create their own representations and share them with the class they can discover for themselves the most efficient ways to display data, and this lesson will not happen if you choose the graph, table or chart for them. In fact, at the beginning of this workshop you will notice that I asked you to create a foldable or graphic organizer to help you to organize the information that you were going to learn about the process standards. During my workshops I can tell you that every organization is different, some better than others, but all useful to the person creating them. When we share how we organized it we realize that it didn't just have to look like my picture of the foldable on the top of the page, it could be anything, just as long as it kept the information organized.
Is Learning the Process of Data Collection Really That Important?
The following Ted Talk video does a really really good job of explaining why our students need to become scientifically literate, and why we as a nation and a world need to be able to read and understand data.
I know, I know, Texas has made a big deal over the Scientific Method in the past few years. You may have heard it referred to as the components of Scientific Inquiry because in the real world the Scientific Method doesn't really happen in a specific order. A scientist may not always start off with a Question and then go right into Research and then a Hypothesis. I have even been to trainings where a very noted person said to take down all of our Scientific Method posters in our science labs because Texas doesn't teach the scientific method anymore! But before we throw the baby out with the bath water, we need to look at things reasonably before we start calling it a "witch" and burn it at the stake. If you look at the knowledge and skills statements of all of the science process standards 3-12, you will notice that the skills listed under "Scientific Inquiry Methods" look very similar (if not exactly like) the Scientific Method. That is why I asked you to list the steps of the scientific method, because if you know those steps, you pretty much have section 2 down and can use it. This workshop is all about making things easy to teach and do...
So lets address the elephant in the room, the part that is making you feel like you are breaking a rule because you have been told that Texas Science is all about 3 Investigations of Inquiry. For example some scientists discover phenomenon through observation and describing what took place, not necessarily testing. Sometimes scientists are looking for correlations from indirect data. This is the reason for coming up with the " 3 TYPES OF INVESTIGATIONS: Descriptive, Comparative and Experimental." I will address cooking with those 3 later, because really in the realm of scientific inquiry, all 3 of the investigations have elements of the Scientific Method in them because all science is truly proven through the Scientific Method. Yes scientists make descriptive and comparative observations, but when their conclusions from their observations or their comparative studies are published you better believe that there is some scientist out there waiting in the wings to replicate the work through the Scientific Method. Science is all about proving things and the Scientific Method is the accepted way of proving science around the world.
Replication and Reliable Testing
The idea of REPLICATION is super important. If things cannot be replicated in a lab or observed repeatedly in a natural setting then ideas are disproved. Scientific history is super exciting to read about just because of all of the arguments and fights that scientists have had with each other as they've tried desperately to disprove each other. Current results in Science testing for STAAR indicate that kids have problems understanding data collection and it may be because we don't spend enough time in the classroom allowing kids to take data collection through the whole process. My personal belief is that by concentrating so much on getting kids to identify different types of investigations we might have forgotten that there are rules for how to prove your work, which is to provide replicable and reliable data. Just know that Scientific Inquiry Methods are super important to the world of Science and we should be giving them a direct teach, even if that means chopping the steps into pieces and infusing them into different types of inquiry so that kids can get more practice.
But I do hands-on investigations in the lab, doesn't that mean we are already doing Scientific Inquiry Methods?...
Just because you do inquiry or hands-on lab investigations doesn't mean that your kids are aware of the Scientific Method, what it is and how to use it. Here is a great way to tell, ask yourself these questions:
- Did my students create their own questions to investigate or did I provide them with the question?
- Did my students design the investigation or were the steps provided for them?
- Did my students choose the materials and tools they were going to use?
- Did my students design their own method for collecting data or did I provide the means for the data collection
- Did my students organize the data so that it made more sense to them or did I provide them a way to organize it?
- Could my students determine whether the data they collected was reliable or replicable?
Letting your kids have Aha moments with Data Collection:
Do your kids know why it is that scientists organize information? Data collection can be lengthy and voluminous. Just because they are able to fill in a data table or are able to plot a graph or even read it, do they know why they are making a chart or graph in the first place? The whole purpose for organizing data is to take information that is collected and make it so it is easier to read. The only way your kids will actually learn this lesson is if students are allowed to design and create their own data collections! Data collection in the classroom has become a time spent filling out forms, a meaningless task that kids have to do while they are checking out a cool phenomena. Do they care about the data they are collecting? Not necessarily. I asked my students to remember a graph we filled in from a cookie cutter worksheet (you know, the kind with the built in graph lines) and they couldn't remember the graph they filled out. I was surprised because they really loved that lab, but as it turned out, they loved the activity, not the data collection. I spurred their memory when I said, "you remember, the time we were timing the melting ice cubes?" and all of a sudden they remembered! Wouldn't it be something if I could have said, "Remember that awesome graph you designed about the melting point?"
Kids also need to realize what types of organizations are more efficient. Is it better to use a table or graph or both? Can the data even be graphed? Do I use a triple t chart or a Venn diagram? When kids are allowed to create their own representations and share them with the class they can discover for themselves the most efficient ways to display data, and this lesson will not happen if you choose the graph, table or chart for them. In fact, at the beginning of this workshop you will notice that I asked you to create a foldable or graphic organizer to help you to organize the information that you were going to learn about the process standards. During my workshops I can tell you that every organization is different, some better than others, but all useful to the person creating them. When we share how we organized it we realize that it didn't just have to look like my picture of the foldable on the top of the page, it could be anything, just as long as it kept the information organized.
Is Learning the Process of Data Collection Really That Important?
The following Ted Talk video does a really really good job of explaining why our students need to become scientifically literate, and why we as a nation and a world need to be able to read and understand data.
The importance of Scientific Literacy
Being scientifically literate is crucial in our age because scientific knowledge is growing exponentially. There is no way we can teach every scientific fact out there, but we can help kids to be able to distinguish between bad science data and good scientific data, and we can do that by teaching them the Scientific Method. Predicting and analyzing trends from data is heavily tested through STAAR dual coding in 8th grade and Biology EOC. Having your students practice aspects of the scientific method of inquiry will help your students conquer many questions on the exam. Get ready, because I'm about to show you how easy it can be to become a chef, it just takes some time to learn the steps and to recognize where your opportunities are.
Can't remember Section 2 of the Process Standards? Just use the Scientific Method!
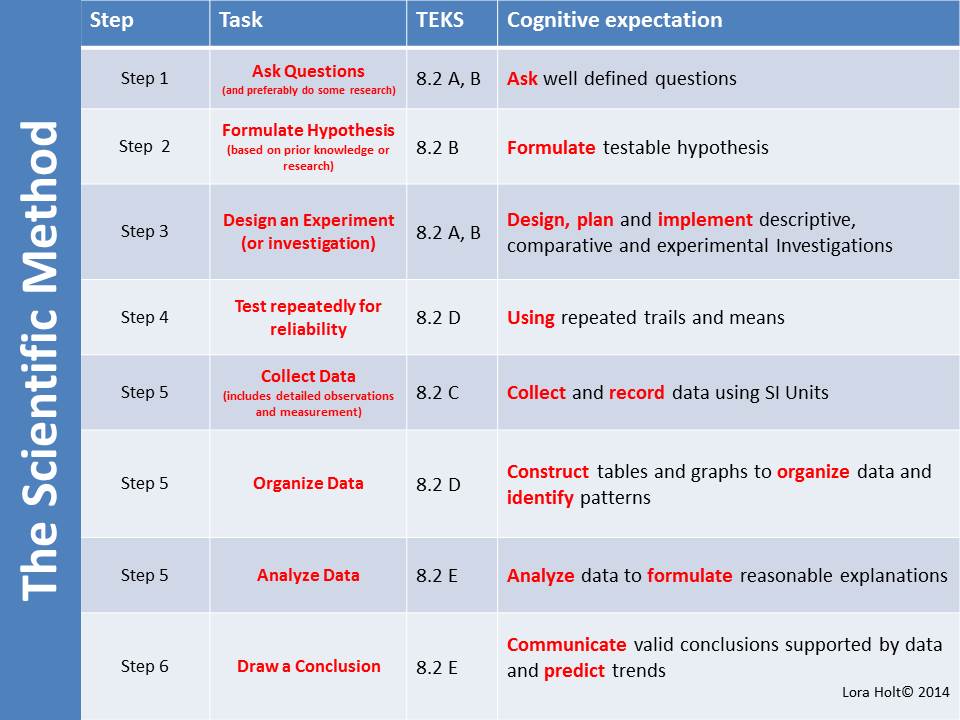
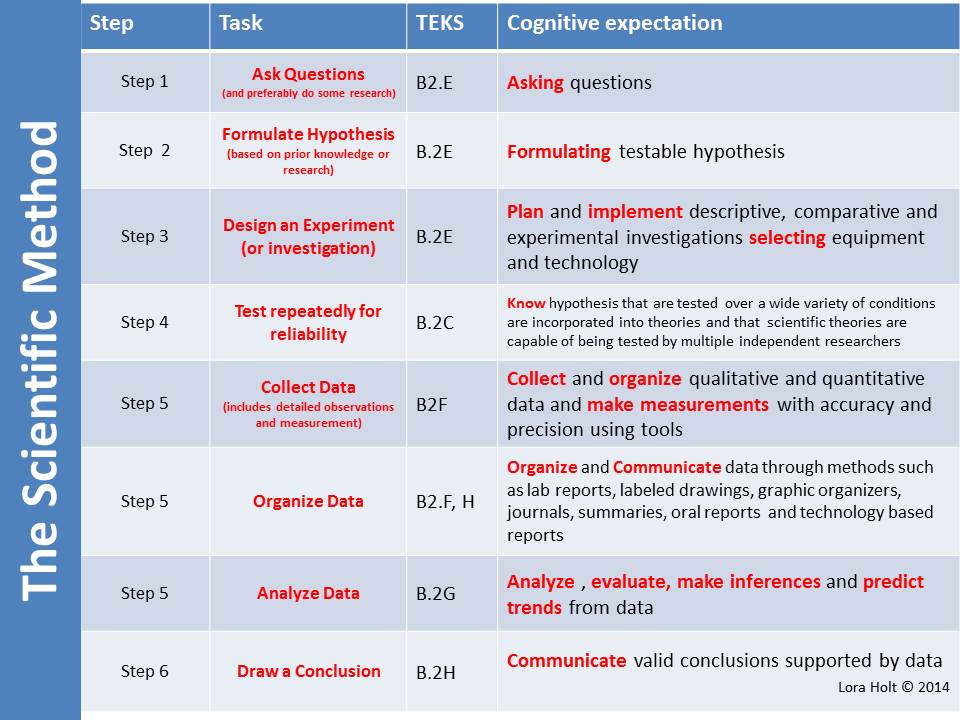
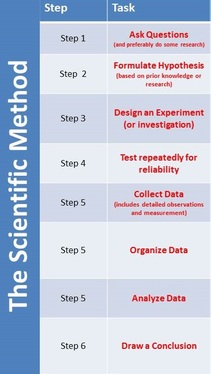
Not all investigations can be considered full blown experimentation, but all investigations, Descriptive, Comparative and Experimental will contain aspects of the scientific method as the basis for the inquiry. To make it easier on myself, I use this chart to help me to remember to infuse this method into my lessons. Below are some graphic organizers that you can use to help you remember your standards when doing any part of the Scientific Method. If you know the method it is easy to remember and in turn easy to do the direct teach while doing a lab.
Being scientifically literate is crucial in our age because scientific knowledge is growing exponentially. There is no way we can teach every scientific fact out there, but we can help kids to be able to distinguish between bad science data and good scientific data, and we can do that by teaching them the Scientific Method. Predicting and analyzing trends from data is heavily tested through STAAR dual coding in 8th grade and Biology EOC. Having your students practice aspects of the scientific method of inquiry will help your students conquer many questions on the exam. Get ready, because I'm about to show you how easy it can be to become a chef, it just takes some time to learn the steps and to recognize where your opportunities are.
Can't remember Section 2 of the Process Standards? Just use the Scientific Method!
Not all investigations can be considered full blown experimentation, but all investigations, Descriptive, Comparative and Experimental will contain aspects of the scientific method as the basis for the inquiry. To make it easier on myself, I use this chart to help me to remember to infuse this method into my lessons. Below are some graphic organizers that you can use to help you remember your standards when doing any part of the Scientific Method. If you know the method it is easy to remember and in turn easy to do the direct teach while doing a lab.

Cooking with GAS: Your Best Science Chef tool will be the Scientific Method!
Section 2 of the processes will be easy to teach as long as you have the scientific method down pat. Its a lot easier to remember the scientific method if you remember it in order, even if you find that you don't necessarily do it in order. The parts of the scientific method are just best practices in Science so if your kids can do them then they can reach the tough part which is predicting trends and arriving to a conclusion. The idea here is that kids cannot read graphs and interpret data if they haven't had a chance to ask a question, design a study, and collect and organizer data for themselves. Here is an example involving another animal investigation but I will cite some other investigations as well:
Cookie Cutter Lab: Cricket Incomplete Metamorphosis
Activity: Descriptive investigation: Students will observe crickets through their life cycle. They will record their observations in their science journal over a period of a month answering questions from a pre-made journaling form. Students will keep track of how many crickets eventually will molt and produce wings
Content Standard: 5.10 C Describe the differences between complete and incomplete metamorphosis of insects
Notice how this cookie cutter lab was instantly transformed by having the students ask well defined questions. An activity that was once just a simple observation of looking for crickets who have wings and filling out a worksheet about crickets can turn into a full blown inquiry with lots of aspects of the Scientific Method thrown in. Now you aren't only covering incomplete metamorphosis but also structure and adaptation, environment, food chains, and survival, and that's okay because you have to teach those too!! If you know your scientific method a drab cookie cutter activity can turn into a chef like smorgasbord of scientific investigations that are student owned and generated! Does it work with comparative investigations too? You bet! Check out this next example:
Cookie Cutter Lab:
Activity: Comparative Investigation: Comparing the boiling/freezing/melting points of water on the Celsius scale
The students will record data as to what Celsius temperature that water freezes/melts and boils. Will use their journal sheets to record their observations (boring)
Content Standard: 5.5B Identify the boiling and freezing, melting points of water on the Celsius scale.
Working with Models and Demonstrations
Sometimes a science lesson will not lend itself to testing nor will it allow for a graphable data collection. Say you are teaching atomic structure and you are working with a model to demonstrate the structure, there are no opportunities to graph data in this case, but a student CAN DO aspects of the scientific method, for instance they can ask questions, they can definitely organize the information they collect by constructing diagrams (ex: diagram of an atom) or charting information (which is the reason for the periodic table) , and they should be drawing inferences or conclusions from the information that they have collected.
Sometimes an investigation is too dangerous for kids to do or you simply want to engage students with a demonstration that will catch their attention and engage them into the content. Again, aspects of the scientific method can also be applied because the students are asking questions, collecting information as they jot down their observations and preparing themselves for further research.
Testing with models
Another way to insert scientific inquiry into models is change a variable that makes the model work and make detailed observations of the results or determine a criteria to judge the results. This can be done by applying an effect/affect question to the model. Here are some examples:
To make it even more authentic, have the students generate the questions for the model and the changing variable and have them design their own tests!
But in the realm of working with models and demonstration there is actually a whole Knowledge and Skills statement dedicated to working with scientific ideas and critiquing the relevancy, which is Section 3 of our foldable dedicated to Critical Thinking and The History of Science. If you are ready for this section click on the "Next" button.
Section 2 of the processes will be easy to teach as long as you have the scientific method down pat. Its a lot easier to remember the scientific method if you remember it in order, even if you find that you don't necessarily do it in order. The parts of the scientific method are just best practices in Science so if your kids can do them then they can reach the tough part which is predicting trends and arriving to a conclusion. The idea here is that kids cannot read graphs and interpret data if they haven't had a chance to ask a question, design a study, and collect and organizer data for themselves. Here is an example involving another animal investigation but I will cite some other investigations as well:
Cookie Cutter Lab: Cricket Incomplete Metamorphosis
Activity: Descriptive investigation: Students will observe crickets through their life cycle. They will record their observations in their science journal over a period of a month answering questions from a pre-made journaling form. Students will keep track of how many crickets eventually will molt and produce wings
Content Standard: 5.10 C Describe the differences between complete and incomplete metamorphosis of insects
- Opportunity to add in: Asking Questions: Before starting the observation, place the container of crickets on the desk and have students generate as many questions as possible about the crickets. Have students narrow down the questions as easy to answer and not so easy to answer and those that require testing. (They will probably ask about life cycle which is a great lead in to incomplete metamorphosis, however this will also allow the crickets to be used to teach several standards at once because the students will probably ask about environment, predators, food chain, food web, structure, adaptations, etc.
- Opportunity to add in: Data collection: Once the students have generated questions, have them perform research on the crickets to answer most of their questions.
- Opportunity to add in: Organize data: Have the students organize their data so that it is easy to read, have them decide which student representation does this job the best.
- Opportunity to add in: Testing, verification and recording observations: They will probably find out through their research that crickets have incomplete metamorphosis, have them verify that information through observations of the crickets in class over a period of a month. Have the students design their own charts to track body changes and have them design their own method of observation.
- Opportunity to add in: Create charts and diagrams: have the students diagram a crickets body and identify adaptations that they have for survival. They can also draw diagrams or charts for food web, food chain, O2-CO2 cycle, etc. The sky is the limit here and all you are doing is having them answer their own questions.
Notice how this cookie cutter lab was instantly transformed by having the students ask well defined questions. An activity that was once just a simple observation of looking for crickets who have wings and filling out a worksheet about crickets can turn into a full blown inquiry with lots of aspects of the Scientific Method thrown in. Now you aren't only covering incomplete metamorphosis but also structure and adaptation, environment, food chains, and survival, and that's okay because you have to teach those too!! If you know your scientific method a drab cookie cutter activity can turn into a chef like smorgasbord of scientific investigations that are student owned and generated! Does it work with comparative investigations too? You bet! Check out this next example:
Cookie Cutter Lab:
Activity: Comparative Investigation: Comparing the boiling/freezing/melting points of water on the Celsius scale
The students will record data as to what Celsius temperature that water freezes/melts and boils. Will use their journal sheets to record their observations (boring)
Content Standard: 5.5B Identify the boiling and freezing, melting points of water on the Celsius scale.
- Opportunity to add in : Design your own investigation: Ask question, "At what temperatures Celsius does water change phase?" Have students design their own investigation to find this out by choosing their own tools, procedures, safety rules, and data table etc.
- Opportunity to add in: Create your own data collection: Have the students create their own data tables and graphs as they investigate the following questions, "Does the water temperature go up if you boil water for a longer amount of time?" you can also have each group investigate a different question like, Does the amount of water affect the boiling point? Does the amount of heat affect the boiling point? Same type of questions for melting point (like melting over time, or amount of water to freeze, or amount of ice to melt, etc.
- Opportunity to add in: Formulate a Hypothesis: Now that the students are aware of the boiling, freezing and melting points of the first investigation, when they investigate the second set of questions they will have sufficient background knowledge to formulate a hypothesis based on some type of evidence or experience.
- Opportunity to add in: Analyze data, Draw a conclusion, predict trends: Does amount of time, amount of heat, or amount of water affect the boiling point, freezing point or melting point? Have students write a conclusion siting evidence from their data that they collected in their graphs and charts that they themselves created.
- Opportunity to add in: Communicate conclusions in writing and verbally: Have the students report out their charts and graphs and read their conclusions to the class for discussion and critique
Working with Models and Demonstrations
Sometimes a science lesson will not lend itself to testing nor will it allow for a graphable data collection. Say you are teaching atomic structure and you are working with a model to demonstrate the structure, there are no opportunities to graph data in this case, but a student CAN DO aspects of the scientific method, for instance they can ask questions, they can definitely organize the information they collect by constructing diagrams (ex: diagram of an atom) or charting information (which is the reason for the periodic table) , and they should be drawing inferences or conclusions from the information that they have collected.
Sometimes an investigation is too dangerous for kids to do or you simply want to engage students with a demonstration that will catch their attention and engage them into the content. Again, aspects of the scientific method can also be applied because the students are asking questions, collecting information as they jot down their observations and preparing themselves for further research.
Testing with models
Another way to insert scientific inquiry into models is change a variable that makes the model work and make detailed observations of the results or determine a criteria to judge the results. This can be done by applying an effect/affect question to the model. Here are some examples:
- How does the placement of breakwaters affect the erosion on a beach? (students test different ways to place breakwaters (popsicle sticks) into a beach model to test effects of erosion (sand that was eroded away can be collected and measured)
- How does the saturation of minerals in water affect the growth of a stalagmite, stalactite model? Students experiment with the amount of epsom salt in a super saturated solution to create stalactites in a cave model. (students can measure the heights or sizes of the crystals grown over a period of time)
- Erosion, flow and deposition models: What are the affects of flow rates using different sized holes in a container to regulate flow?, What are the affects of plants and roots placed in soil models?, Do rocks or gravel in the soil affect the rate of erosion?, etc. (Students can measure sand displaced in each trial)
To make it even more authentic, have the students generate the questions for the model and the changing variable and have them design their own tests!
But in the realm of working with models and demonstration there is actually a whole Knowledge and Skills statement dedicated to working with scientific ideas and critiquing the relevancy, which is Section 3 of our foldable dedicated to Critical Thinking and The History of Science. If you are ready for this section click on the "Next" button.